So, as I said in my last post, I want to digitize the world around me, starting with the sensors on my Raspberry Pi 3B+ and SenseHAT attachment.
After much thinking, writing down ideas and generally trying things out, I finally got things working the way I wanted for the most part. Here's what I have so far.
1. Sensor Units: These are the Pi's with the SenseHAT and have the following programs running to enable the features I want (Only the HTTP server is not done by me, I just installed one).
- Sensor Readings to File: A simple program that reads "all" the sensors and writes the results as a string, each value separated by a ",". It creates one line each time its run. It auto runs every 5 min through cron (Linux scheduler). You could also do something similar with Windows "Task Scheduler".
- HTTP Server: The HTTP server just lists and allows downloads of the sensor data files.
- SenseHAT Joystick Controls: A small program auto runs with the pi and allows you to use the 5 "button" joystick to run commands and display info on the 8×8 LED grid. It currently does the following, which helps a great deal when there is nothing attached but the SenseHAT and power. I also have VNC / SSH enabled on the Pi's to connect remotely.
- 1. Display IP
- 2. Display CPU Temp
- 3. Display SenseHAT Temp
- 4. Shutdown
- Sensor Data over WiFi: Another small program runs automatically and listens on the network for my client app to request data.
2. Portable Sensor Data Display and File Downloader: This is a PI with a 2.7" E-Ink display with 4 buttons. It simply runs one program on boot to do the following.
- Show it's own system information, including IP
- Display Current Sensor Readings
- Download Sensor Data Files
- Shutdown
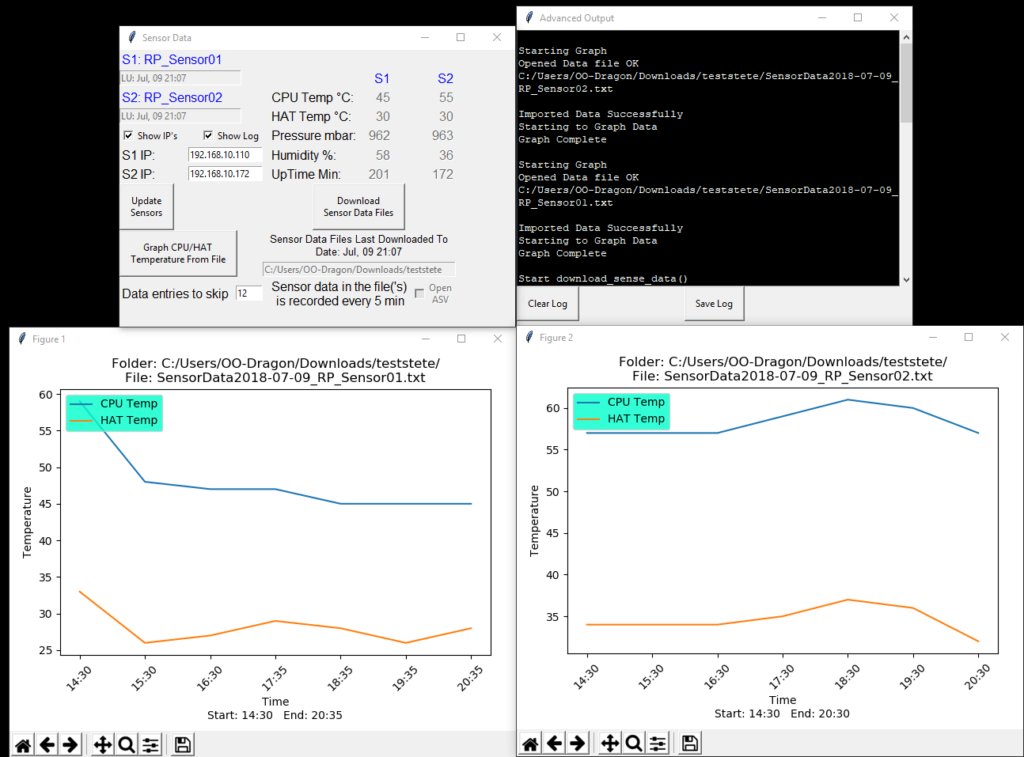
3. PC: I made a more in depth GUI app for the PC, that can connect remotely to the units to gather information. It has a lot more options, and is a bit easier to show a picture.

Python3 Sensor App
Its still a work in progress, but as you can see, I can already compare Sensor readings over time. I can also specify how many entries to skip when graphing the data files, as there should be about 288 entries for a day, after which, the program creates a new file for that day. Plotting 288 points can not only take a bit of resources, but also isn't needed for most things being looked at. So I set it at 12 by default, so it shows a reading every hour.
All these separate systems, apps and scripts connect through a mini router I got for $35 that's powered by USB. This enables me to take the E-Ink pi and the mini router, power them both up off a USB battery Bank and wait about 2 min for the Units to boot and the Sensor Units to auto connect to WiFi, and I can then pull data remotely from the units, up to however far the router's and pi's range are (50-100 meters?). Great for putting Sensors on tree's, in water, down a hole, etc, etc.
I also enabled a OpenVPN server on the router itself, allowing me to connect through the internet and grab the sensor data with my PC program. This can be done, even from remote sites through 3G or 4G connectivity (AKA cell phone service). Simply add a USB dongle for 3G / 4G to the router, and BAM, I can suddenly connect a lot of units, within a decent range to the internet for remote monitoring and maintenance!
That's pretty much were I am at now. I'm also working on other aspects like Pi Cases for weather proofing or even water and underwater deployment. High altitude balloons are also in the future.
I think that about does it for this post. I'll eventually post my Python code too, but I wanted to clean it up and add some comments to explain things first (being my first Python project and all).


Recent Comments