So I mentioned last post I was probaby going to use a pre-made HTML generator, but turns out I can get my own to work without too much trouble. I now have it building the HTML file on the fly, by only adding sensors that check as online.
Here's a few screen shots of the changes.
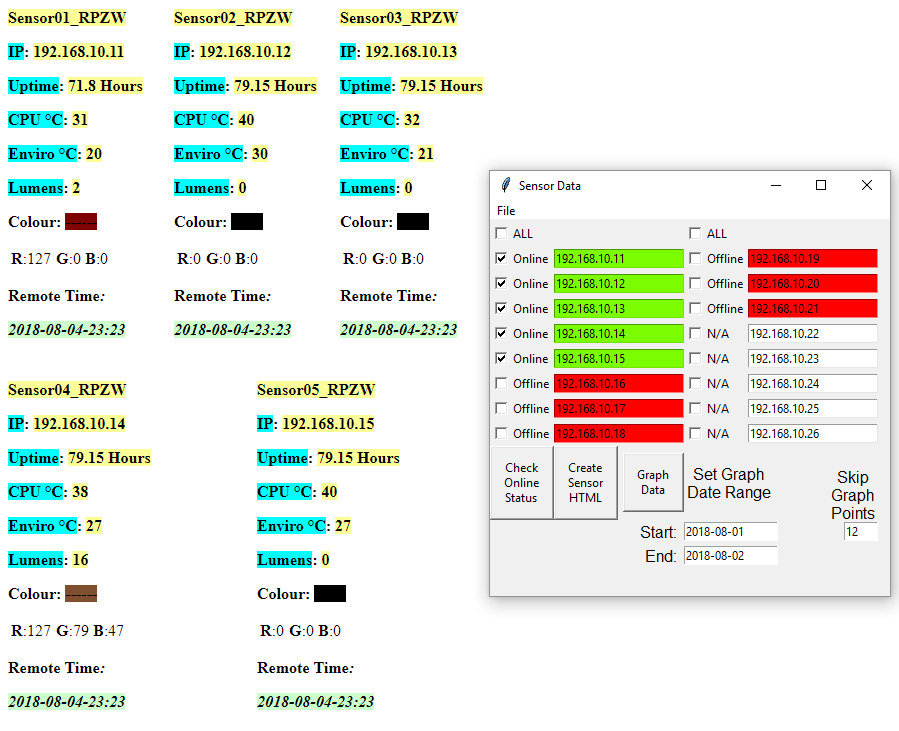
This first one shows the HTML page dynamically made in the background. It groups them in 3 per row and basically unlimited columns. I re-designed the PC app, in order to allow more sensors, and let the HTML page + Graphs handle the data. When you "Check Online Status" of sensors, it auto unchecks any that are found to be offline, so you don't have to wait a long time for all the sensors to timeout in later operations. I have also set the timeout to 2 seconds when checking sensors.
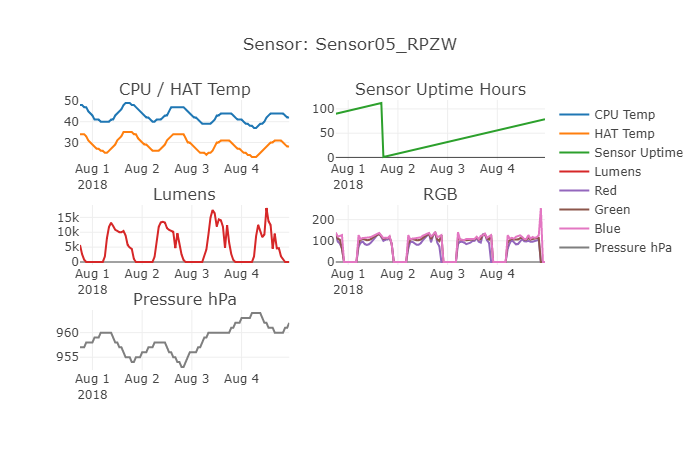
I'm using plotly for plotting now, and its SOO nice! As you can see above, you can select the timeframe and how many data recordings to skip before plotting (It asks to open a sqlite3 database file, which you download off the senors). This allows for flexible viewing for both details and timeframes. Thanks to plotly, this all looks super nice too! Through plotly, the graph is actually a HTML page, of which you can do other tasks like save it as a pic, upload to their online editor and more!
There are some other things updated too, but this is the main stuff. I'll probably prioritize attaching a air quality sensor to the hardware now, as its been REALLY smokey out here the past 3 years or so due to soo many forest fires. I hope to see just how bad the air is during these times and others.
0 Comments.