Monthly Archives: August 2018 - Page 2

Program License – GPL

I mentioned before that I would post my code, which I will indeed post, but the more I thought on it, the more I realized I should probably choose a license model for the program now, before actually posting any code. 

To this end, I have decided on the GNU GPL Version 3.  I am 100% for sharing and making sure it stays free for anyone who thinks its useful and wants to use it.  If it ends up being used by a company with money, I would sure appreciate funds to continue development and get a few research stations going.  I'm also very much open to adding pretty much any sensor to the units, if you send me a few for testing. 

I'm going to work on the Installer and install scripts for the next few days, so that people can easily get this up and running to try out.  Of course the hardware is still needed to be effective, but I'll be sure to include a section in the Help Menu of the PC program, that will help you make your own sensor unit. Ultimately I would like to give people the ability to digitize the world around them easily, to find out all kinds of Cool stuff.  You never know what you'll find after visualizing the data in different ways.  

I'm thinking I might have something usable by the beginning of September, 2018.  That doesn't mean bug free or pretty, but it will be usable! 

I have already spent a bit of time on the PC installer.  I have been updating my hard coded locations in the program to system variables, so it can be installed and run from any windows computer (Will have to double check if the system locations work in Linux too).  It has just passed being usable on a different computer after running the installer.  The installer puts a folder of Python 3.7 in the app directory and the shortcuts link directly to it, running the script.  The sensor installers are already working fairly well, but I would like to customize it to ask for certain variables upon running it, so its a one stop shop to configure and install.  

I'll post the update log in a later post.  
Enhancements / Plans / ChangeLog

Since I do lots of testing on the fly with multiple sensors, I thought it was about time to add some functionality to the program around sensor control.  

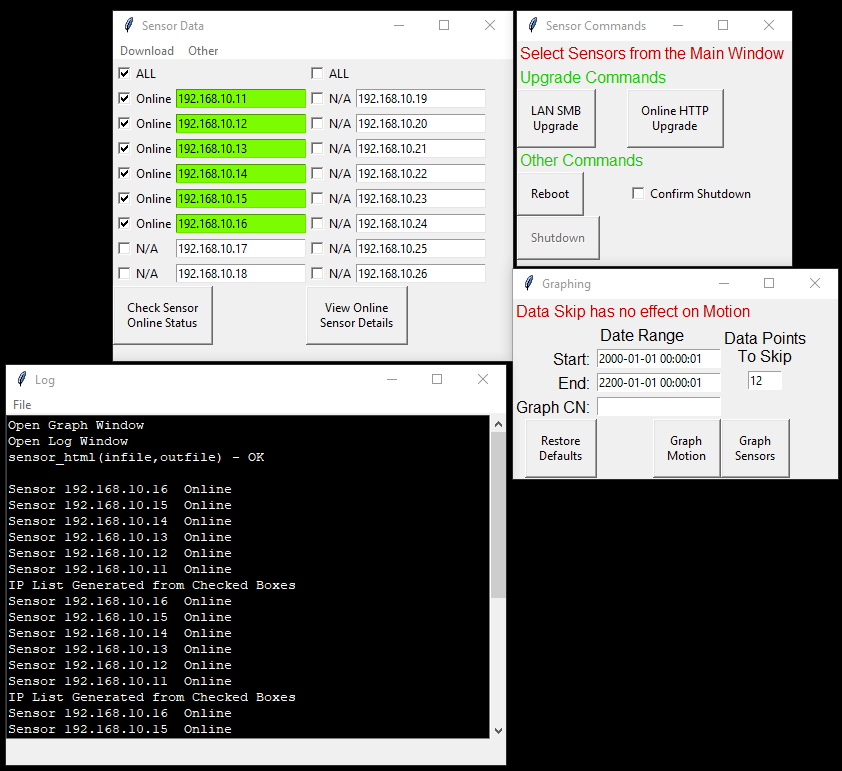
Up until now, I have used SSH for 90% of my sensor interaction, but there is really only 2 things I do a lot of… Update the programs and reboot the sensor.  So to that end, I have added a "Sensor Commands" section to allow just that and more.  Essentially, you check the sensor('s) you want to do something with in the main window, than click a command button like upgrade, reboot or shutdown.  It will send the command to all selected sensors.  

I added a SMB update (Windows shares) and a Online HTTP update (allows upgrading remote sensors with internet access).  I added a checkbox for the shutdown, so I don't accidently click it during quick testing.

I have also created a Windows Installer for the program, which includes a install of python 3.7 with the required libraries.  I originally just created a single .exe using pyinstaller, but Plotly didn't seem to like working with it, so I thought the next best thing was to just make the install easy.  It also runs much faster this way!  

Some of the things I hope to add in the near future include.

  • Put phpSysInfo on Sensors, using lighttpd server for system diagnostic Information
  • Update output files to local user desktop
  • Improve Graph outputs and Options at generation
  • Have update script terminate programs at the end, so the updated versions can start with improved crontab autostart
  • Improve Install scripts for ease of use
    • Ask and auto set Hostname, IP, Wifi, etc
  • Have program write config to file, and load it on boot to Include
    • IP List for Sensors
    • Default Date ranges in Graphs

I spent some time going over the back end code, and thought it best to merge a few things.  So here's yet another changelog.

ChangeLog Aug 15th, 2018

  • Merged 2 .py programs into one for socket communication
    • Merged the live sensor data send with general socket commands
  • Improved logging
  • Added Time corrections to Motion Graph (timezone)
  • added Sensor command "Terminate Sensor Programs"
  • Changed Auto Start method from rc.local to crontab scripts.  
    • Auto runs script every 1 min
    • The script checks to see if the program is running
      • If not running, start it
      • If running, do nothing
      • Allows crash recovery and applying remote updates without restarting the unit
  • Updated E-Ink Controller with Static IP 
    • Updated E-Ink & Sensor update scripts to match new IP
  • Updated Motion Database to save IP for better graph Sensor Identification 
  • (35% done) Started creating a Database "Splitter / Merger / Updater" program to allow
    • Modifications of old databases to newer models or merging with additional fields 
    • Split databases for Later analysis or archiving (X timeframe is in Y location, take just that timeframe and store in new database for later access). 
  • Updated 'Update scripts' 
    • Improved Speed (less network copies)

Changes and Improvements

​Probably no big surprise to anyone, I have changed the Sensor programs some more!  Enough to deserve a couple of new screen shots. 


There are a fair amount of both Major and Minor changes, both front facing to the user and on the back end.  

Major Changes

  • Put Graphing into its own Window + made the time selection more accurate
  • Separated Sensor checks for data retrieval vs checking online
    • Faster Online Checks
    • Allows Different functions on same socket connection
  • Added SQL database Sizes to Sensor Information HTML page
  • Updated SQL queries to handle more data points for graphing
  • Added Motion detection recording to Sensors (Separate database, checking 4 times every second (0.25 seconds), recording if its change more then 0.05 since the last recording (If any axis changes that much, it records all data))
  • Added Graphing option for the Motion Database
    • Motion graphing bypasses the "Data Points To Skip"

Minor Changes

  • Updated code to auto check selected sensors before trying to get data (database, current readings)
  • Updated and cleaned up Log code (tracking progress through program)
    • Before writing new log data, remove all white space before and after text in the log window
    • Add "Relay" functions in order to return better log details from custom imports
  • Updated some Variable and Function names to better match their actual function
  • Broke up code into new def statements and used for statements to simplify code and make more readable. 
  • About 5 or so other changes I can't quite remember…  

I spent a great deal of time working with the SQL queries, especially because I had to convert the time text from the program date selection, into something I could compare to from the database.  I could of saved a lot of time by making sure it printed out the 2 comparisons from the start all the time, but since I didn't… that was a good 10+ hours spent!  Its all sorted out now and it should be much easier to spot future errors in input calculations. 

While dealing with the SQL queries them selves, I quickly found out, that too many data points in a SQL database, will make getting, holding and manipulating the data in a single grab, a no go (Goes slow, if too many points, just doesn't do the graph).  Thanks to a misaligned threshold setting on my motion detection by 0.02, It was recording every few seconds…. sometimes more often.  It quickly added up to a 6MB database.  This gave me the chance to test my Graphing with large data sets, and it successfully graphed just shy of 160,000 data sets PER Time/X/Y/Z.  That's about 640,000 data entries!   Even on my Ryzen system, it took about 10 seconds to process that.  However, this is an unusual amount of data and most of my readings will never reach this level.  Its still comforting to know I can process that much, as it will be useful for reviewing long term data.  It may also become necessary to compare multiple sensors in a single graph, which would multiply the data entries by however many sensors you needed to compare.  

Here is how smokey it looks out side my window… I wish I could say that's clouds or mist, but its smoke at about 11AM in the morning on a Sunday…. Terrible terrible smoke…

Super Smoke

Tweaking Town

So I have not quite got the motivation to do some soldering for the Air Quality sensor.  So instead I have been tweaking the program and thinking about future endeavors with it.  To that end I am figuring out how I may utilize the already built in accelerometer to track things like tremors or earth quakes.  looking at the readings, it doesn't get very accurate (goes to like 9 decimal points, but sitting still makes variation in as much as 0.01). 

The seemingly not so accurate readings may be literal movement (cars, construction, etc)  in the area I am in, but I won't know for sure, until I take it somewhere more… stable and less populated.  Depending on what I hope to track, I'll change how many decimal points I record (hoping that it won't record anything until something happens, saving resources).  This may come in handy later, if I for instance, put a sensor in a tree with battery and solar.  Should a squirrel decide to touch, nibble or throw the sensor down, It could record the event.  With a Internet connection of some kind, I could be notified, so the sensor doesn't stay offline or in the wrong place for too long. 

In either case, that will be done later, as I need to see what kind of resources and space these readings will take. I tried a few things that didn't work due to SQL stuff last night, but the rest of the code is basically done.  I need to figure how, why, when and where I'll record the data.  Due to the constant writes, I may create a whole new database, so database downloads don't take too long over time.  

Other small changes done include.

  • Making the RGB values/lines on the graph Red / Green / Blue
  • Added TextBox for Custom Sensor name in Graph (makes it easier to look over, as "Kootenay Lake North" then "Sensor2")
  • Changed graphing from 2 columns to 1 (larger area for the timescale)  and put RGB beneath Lumens (compare raw light value to colour spectrum).  

I also uploaded a HTML page of my "Back Yard Shed" sensor to my site You can check it out here.  It's about 8 days worth of sensor data.  

http://dragonwarz.net/temp-plot.html


More updates!

So I mentioned last post I was probaby going to use a pre-made HTML generator, but turns out I can get my own to work without too much trouble.  I now have it building the HTML file on the fly, by only adding sensors that check as online.  

Here's a few screen shots of the changes.

This first one shows the HTML page dynamically made in the background.  It groups them in 3 per row and basically unlimited columns.  I re-designed the PC app, in order to allow more sensors, and let the HTML page + Graphs handle the data.  When you "Check Online Status" of sensors, it auto unchecks any that are found to be offline, so you don't have to wait a long time for all the sensors to timeout in later operations.  I have also set the timeout to 2 seconds when checking sensors.  

I'm using plotly for plotting now, and its SOO nice!  As you can see above, you can select the timeframe and how many data recordings to skip before plotting (It asks to open a sqlite3 database file, which you download off the senors).  This allows for flexible viewing for both details and timeframes.  Thanks to plotly, this all looks super nice too!  Through plotly, the graph is actually a HTML page, of which you can do other tasks like save it as a pic, upload to their online editor and more!  

There are some other things updated too, but this is the main stuff.  I'll probably prioritize attaching a air quality sensor to the hardware now, as its been REALLY smokey out here the past 3 years or so due to soo many forest fires.  I hope to see just how bad the air is during these times and others.  


Updates & Changes

So, I was going to use Django… until I realized I can actually just use a HTML template and have python itself edit the variables, and spit out a new copy.  So that's what I did.  I will probably still go to some kind of auto HTML generator, so I can add sensors on the fly more seamlessly, but this is a good start to get the rest of the back end up to date.  I'm also changing a few things to be more efficent, like using 'for' and 'while' loops where I used to have mutliple code for each sensor.  

Here are a pic of the progress.  

GUI App beside the HTML output file.  Its opening the html doc locally, but it will be on the Sensor "Controller", accessed through a http server.  

App & HTML output

I'm pretty happy with the progress.  I'm now waiting on some hardware to arrive, so I can get started on making the Sensors self sustaining for power.  

I have also done a lot of other updates since my last post.  Here's a quick point view.

  • Updated storage method from text file to sqlite3 database
  • Updated *Most code to reflect new storage method
  • Created install script for new sensors -> One command you run in terminal and in the end, you just change a IP and your done!  New sensor ready to go. 
    • Still need to enable or set ic2 / hostname / wifi country
    • Optional: Enable SSH / Set boot to CLI autologin 
  • Updated Sensor "Controller" to enable dual button modes
    • If the same button is pressed again within 5 seconds of the command finishing after the original pressing of the button, it will do something different
    • Button Options 
      • 1a) Display Local Host Info + Age of Update Files on Controller
      • 1b) Update Local programs and Sensor upgrades off Local NAS 
      • 2a) Display Sensor Online & UpTime OR Offline
      • 2b) Download Sensor's Database to local Controller
      • 3a) Upgrade Sensors with progs from Local Controller
      • 3b) Reboot Sensors
      • 4) Shutdown Local Controller
  • Updated script for Controller to install OR update the unit (Can auto detect)

That's it for the most part.  I have also been hanging out on the Raspberry Pi IRC channel, and getting some decent ideas from there.  

Until next time!